• two published evaluations of tone-mapping operators, Kuang et al. 2004 and Ledda et al. 2005, rank the same bilateral operator at opposite ends of the field.
• the flaw is instructive because it is a design flaw, not a statistical one: both compared operators at their **default parameters**. Every operator here has knobs that dominate its output, so what the studies measured was the taste of whoever set the defaults, not the operator.
• read against the checklist above, they fail "sample fairly" (the stimulus for each operator was not a fair representative of what it can do) and "interpret carefully" (a ranking was generalized from one configuration).
• this is why the chapter exists, and why the tone-mapping chapters state plainly that we have no accepted theory of what a good tone map is.
• the counterweight, so the chapter does not read as an argument against ever asking people: in industry a shipping decision does depend on the answer, and large human rating programs are run continuously and are worth their cost. The line is not academia against industry. It is whether a decision depends on the outcome.
{{fig: From Bylinskii, Herman, Hertzmann, Hutka & Zhang 2023, *Towards Better User Studies in Computer Graphics and Vision* (PDF now in `refs/bylinskii-etal-2023.pdf`, arXiv 2206.11461): extract and clear reproduction permission for every figure in the paper, EXCEPT Figures 1 and 3. Concretely: Figure 2 (the five sample interface designs for output evaluation: rating scale, real/fake, select-the-realistic, A/B pair, drag-to-order) and Table 1 (definitions of common UXR methodologies, with the further-reading column). Contact Zoya Bylinskii and Aaron Hertzmann; both are already in the acknowledgments and have granted figure permissions before. Figures 1 and 3 we redraw ourselves, see the two notes below.}}
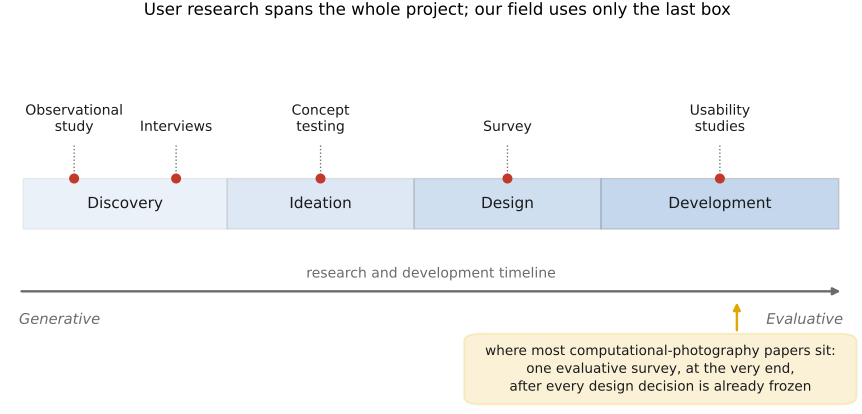
{{fig: Draw our own version of their Figure 1: the user-research timeline. A horizontal research-and-development axis running Discovery, Ideation, Design, Development, with the methods placed along it (observational study and interviews at discovery, concept testing at ideation, survey at design, usability studies at development), and a second axis underneath running from Generative to Evaluative. Our version should be styled to the book and, unlike theirs, mark where computational-photography papers actually sit (bunched at the evaluative end) so the figure makes the chapter's argument rather than only listing methods.}}
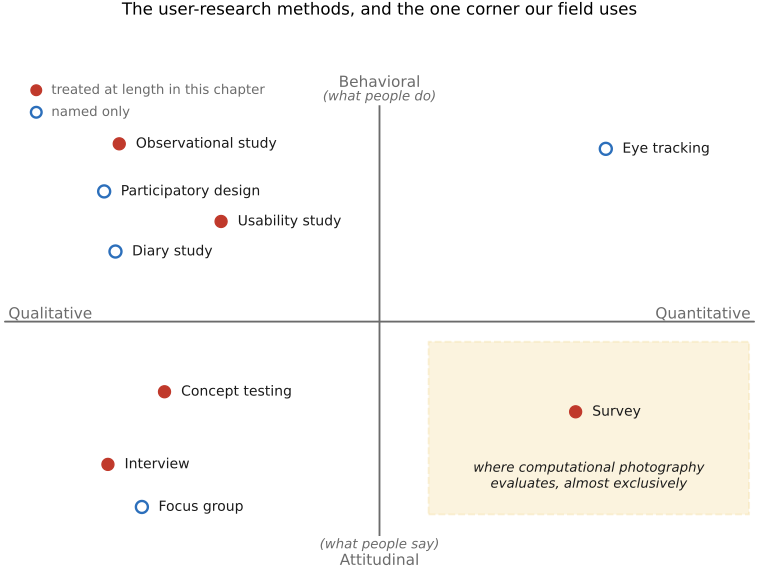
{{fig: Draw our own version of their Figure 3: the method map. Two axes, qualitative to quantitative horizontally and attitudinal to behavioral vertically, with the methods placed in the four quadrants (interview and focus group in qualitative/attitudinal, concept testing nearby, survey in quantitative/attitudinal, observational study, usability study, diary study and participatory design in qualitative/behavioral, eye tracking in quantitative/behavioral). Distinguish the methods this chapter treats at length from the ones it only names, as they do. Their layout is itself adapted from Rohrer 2014, so credit both in the caption.}}