28.7 Average Explorer⧉
The previous section turned a personal collection into a navigable path by aligning, ordering, and morphing it (Chapter 28.6, Photobios). This section keeps the alignment and throws away the ordering: it just averages. Average enough aligned images of one category and the per-image idiosyncrasies cancel while the shared structure survives, leaving a single image that is a portrait of the typical: sharp where the category is consistent, blurred where it varies. The idea is nearly a century and a half old, it was put on a rigorous statistical footing by vision research, it has a vivid life in fine art, and it culminates in AverageExplorer, an interactive system that lets you explore a huge collection through its averages. Throughout, one caution holds: the average is only as meaningful as the alignment beneath it, and the very first person to compute one used it in the service of a poisonous idea.
28.7.1 Galton's composite portraiture: what it was for⧉
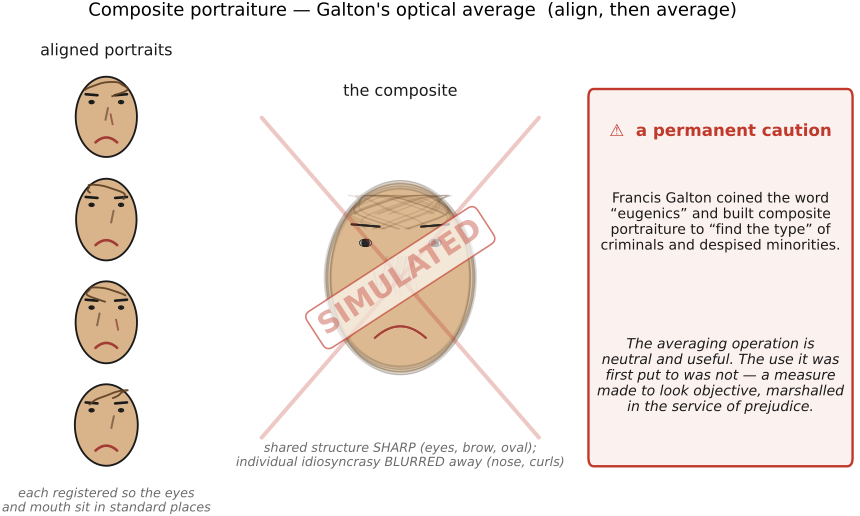
The technique was invented in the 1870s by the English polymath Francis Galton, who called it composite portraiture Galton 1878. The apparatus was photographic, not digital: Galton took many portrait photographs, registered each one so that the eyes and mouth fell in standard positions, and exposed them in succession onto a single photographic plate, giving each a fraction of the total exposure. Where the faces agreed (the placement of the eyes, the line of the brow, the general oval of the head), the repeated exposures reinforced one another into a sharp, definite feature. Where they disagreed (a particular nose, a scar, a stray lock of hair), each face contributed only its faint slice, and the idiosyncrasy washed out into a soft blur. The plate, developed, showed a face that belonged to no one in the stack and yet looked uncannily like all of them: the average face, with the shared structure crisp and the individual variation dissolved (Figure 28.7.1). It is exactly the operation this whole section is about, performed optically, decades before anyone could add pixels.
But Galton did not build this to make pretty prototypes, and the section would be misleading to leave it there. Francis Galton coined the term "eugenics," and composite portraiture was, in his hands, an instrument of that program. He made composites explicitly to "find the type": he averaged the booking photographs of convicts hoping to distil the face of the criminal, he averaged portraits of Jews hoping to fix a racial "type," and he turned the same method on the "feeble-minded" and the sick. The underlying claim, that a moral or racial essence is written on the face and can be extracted by averaging, is pseudoscience, and the project it served, the ranking and "improvement" of human stock, did real and catastrophic harm in the decades that followed. We use Galton's image-averaging idea throughout this section because the arithmetic is genuinely neutral and genuinely useful. We name what he used it for because the method's first application is a permanent cautionary case: a measurement, made to look objective, marshalled in the service of prejudice. The method is mathematically simple, but Galton used it to look for patterns that do not exist.
28.7.2 Alignment is everything⧉
Galton's whole method turns on one precondition that matters: he registered the faces before he exposed them together. That is not a detail; it is the entire reason the composite shows a face at all instead of a brown smudge. Average a stack of portraits that are not aligned, with different scales, head tilts, and eyes landing in different places, and the eyes of one face superimpose on the cheek of another, the mouths scatter across half the plate, and every feature smears into every other. The mean of misregistered images is mush; there is no structure for the averaging to reinforce because no two images put the same structure in the same place. Average aligned images and the shared features stack and survive while only the genuine variation blurs. Sharpness reflects both alignment and actual variation. A sharp feature can also be imposed by a strong registration constraint, so it is not an independent validation of that constraint.
This is the same lesson, in the same words, that Chapter 28.6, Photobios depends on: the photobio could not morph one face into the next until both were warped to a common frame, and this section cannot average one face with the next until the same registration is done. Both follow the same rule from Chapter 12.1, Brute force: register first, operate second. Both pay the price if the registration is sloppy. In the modern, digital version of composite portraiture the alignment is done by detecting facial landmarks and warping each image so the landmarks coincide, after which the average is a trivial sum. The hard, decisive part was never the averaging; it was getting everything into the same coordinate system first. Every "average of a category" in the rest of this section is implicitly an average of an aligned category, and the blurry parts of the result are telling you about variation only because the alignment guaranteed they would have been sharp if the category agreed.
28.7.3 The average of a category⧉
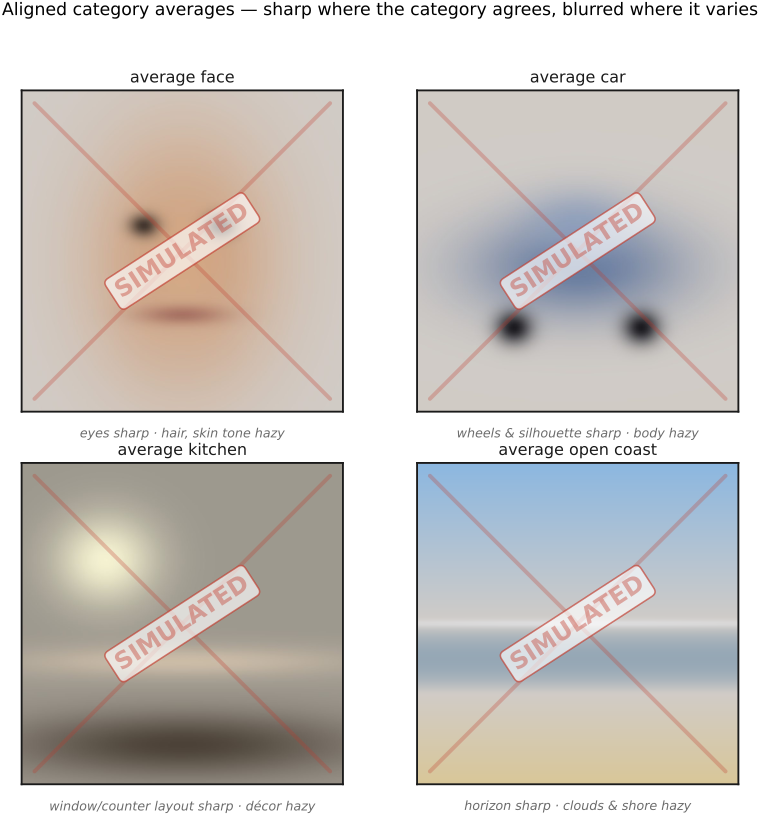
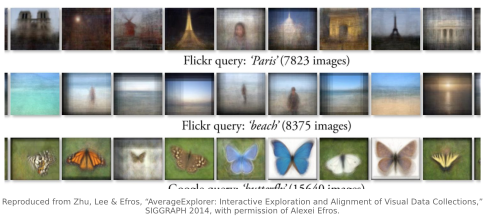
What Galton did to faces, Antonio Torralba and Aude Oliva turned into a general statement about any visual category Torralba & Oliva 2003. Collect many images of one kind of thing, whether a category of objects (faces, cars, bottles, keyboards) or a category of scenes (kitchens, streets, open coasts), register them to a common frame (object-centric, so each instance sits in the same place at the same scale), and average. The result is a category prototype: an image that is sharp wherever the category is consistent and blurred wherever it varies. The average car has crisp wheels and a definite silhouette where every car agrees, and a soft, smeared body where their shapes diverge. The average kitchen has a bright window-shaped patch up and to one side, a counter band across the middle, a dark cabinet mass: the spatial envelope of "kitchen," a common layout in that particular kitchen collection, with all the specific tiles and toasters averaged into haze. The prototype is a picture of the typical, and the map of its own blur is a picture of the category's diversity: where it is sharp the category is rigid, where it is soft the category is free (Figure 28.7.2).
This connects the averaging idea to the statistics of natural images that recur throughout the book. An aligned category average is a non-parametric estimate of the category's mean image: non-parametric because it directly averages the registered samples rather than fitting a specified image distribution; registration and collection selection still impose assumptions; it simply is the empirical mean of the data. It is the same coarse, layout-level summary that the GIST descriptor (Oliva & Torralba 2001 (GIST)) captures when it characterizes a scene by its spatial envelope rather than its details, and it is the same descriptor that powers the retrieval at the heart of Chapter 21.3, Inpainting Using Millions of Photographs. Where GIST summarizes one image by its global layout, the category average summarizes a whole class by the layout its members hold in common. Both deliberately throw away fine detail to expose coarse, shared structure, and in the average, the act of discarding detail is performed simply by letting the detail disagree and cancel.
28.7.4 An artistic lineage⧉
Long before it was a tool for dataset visualization, the category average was a fine-art medium, and the same operation reads completely differently in a gallery. The artist Jason Salavon has made the averaged photo collection his signature: he averages hundreds of same-genre images (newspaper wedding announcements, real-estate listing photos, Playboy centerfolds tabulated by decade, the "100 Special Moments" of mass-market sentiment) into one ghostly prototype in which every individual dissolves and only the genre's convention survives. The bride to the left, the groom to the right, the living-room-then-kitchen march of the home listing: a statistical regularity no single photograph contains, rendered as a picture you can hang on a wall. (Salavon's averages are treated at greater length in Chapter 28.10, Artistic projects with photo collections, where they anchor the "statistical collage" thread.) The British artist Idris Khan works the same vein by hand, layering scanned pages (every page of the Qur'an, every Bernd-and-Hilla-Becher water tower, all of a Beethoven score) into single dense palimpsests where the repeated marks reinforce and the differences blur, an optical average built up by superimposition exactly as Galton built his plate. And Jim Campbell has made illuminated averages, light-box works in which many superimposed frames glow into a single soft composite. The artistic lineage is not decoration on the technical story; it is the same arithmetic pointed at a different question. The scientist's average asks what is the typical member of this category? The artist's average asks what convention does this genre quietly impose on everyone inside it? It answers with the very same blurred prototype.
28.7.5 AverageExplorer: averaging made interactive⧉
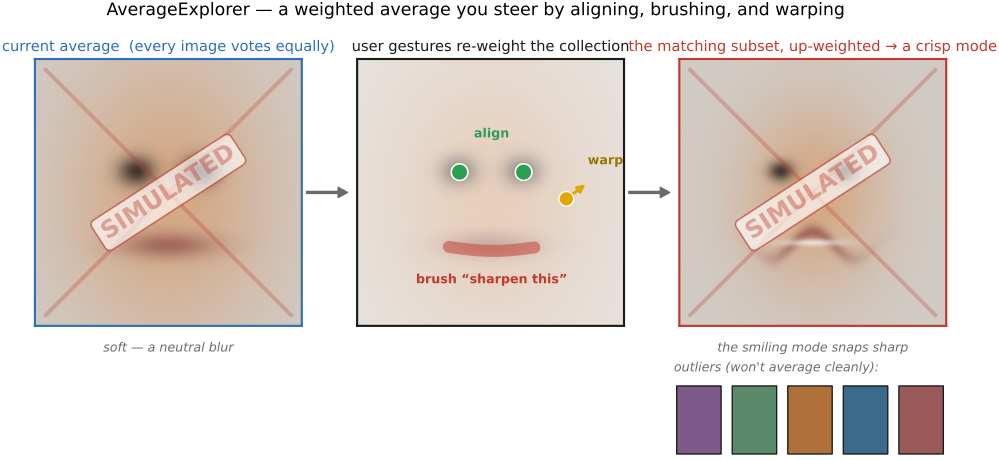
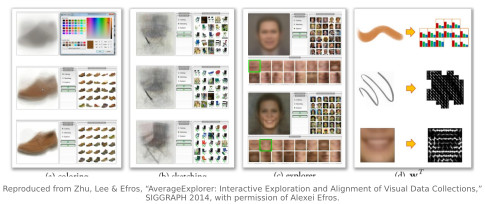
A single category average is one number per pixel, which is informative but static, and it hides as much as it shows. A collection of cars is not one thing; it is sedans and pickups and sports cars, frontal shots and three-quarter views, each a mode of the category with its own sharp average, all of them smeared together if you naively average the lot. AverageExplorer, by Jun-Yan Zhu, Yong Jae Lee, and Alexei A. Efros Zhu, Lee & Efros 2014, turns the average from a static output into an interactive instrument for exploring a huge visual collection. Its core object is a weighted average: instead of giving every image an equal vote, the system weights each image by how well it matches what the user is currently looking for, so the prototype on screen is the average of the relevant part of the collection and updates live as the user steers.
The steering is the contribution. The user aligns by indicating a couple of corresponding points and the system re-registers the collection to that frame; the user brushes a region of the average to say "I care about this part: sharpen it," and the system up-weights images that agree there and down-weights those that do not; the user warps the prototype and the collection follows. Each gesture re-solves the weights, so brushing the open mouth of an average face pulls forward the smiling subset and the average snaps from a neutral blur into a crisp smile; brushing the hood of an average car surfaces the frontal sedans. Because every gesture simultaneously decides which images count and how they are registered, AverageExplorer performs clustering and alignment at the same time, under the user's guidance: it carves the category into its modes (the consistent sub-types, each with its own sharp average) and exposes its outliers (the images that refuse to average cleanly with anything). The average becomes a viewfinder: a way to fly through a million images by continuously asking "what does the part of this collection that looks like this have in common?" (Figure 28.7.3).
28.7.6 What an average is, and what it is good for⧉
A category average is the empirical mean of an aligned image set, and it ties this section to a thread that runs through the whole book. An aligned average is a non-parametric estimate of the category mean, and the mean is exactly the estimator that minimizes expected squared error, the MMSE estimate that Chapter 7.1, Imaging as Bayesian inference with probabilistic priors describes as safe and dull. Confronted with all the faces that could be, the average commits to none of them and returns the bland center of the cloud: the safest possible guess, and for that very reason a boring one, smooth and detail-free precisely because every sharp particular has been averaged away. This is not a flaw; it is a direct consequence of averaging, and recognizing it explains both why category averages look the way they do (soft, prototypical, never anyone in particular) and why a method that wants sharp, specific output must do something other than average (Chapter 28.6, Photobios interpolates selected pairs instead; a generative model samples a mode instead of returning the mean).
That "safe and dull center," used deliberately, is genuinely useful in three ways. It is a dataset-visualization tool: one glance at a category's average tells you its dominant layout, its consistency, and, through the geography of its blur, where its variation lives, a summary of thousands of images in one. It is a bias-auditing tool, and this is where the thread closes back on Galton with a sharp irony: the average of a dataset's "doctor" images, or "CEO," or "criminal," can reveal recurring framing and representation patterns in the dataset: the same operation Galton used to manufacture a prejudice now used to expose one a corpus has silently absorbed. And it is a way to build priors: a category prototype, or a small bank of per-mode prototypes from AverageExplorer, is a compact, data-driven statement of what the category looks like on average, exactly the kind of non-parametric prior the rest of this part keeps assembling out of large collections (Chapter 21.3, Inpainting Using Millions of Photographs, Chapter 28.3, Auto curation). An average is one compact answer to "what does this collection contain?" It can conceal minority groups and distinct modes; inspect constituent images and subgroup counts before interpreting it as a bias audit. Its very simplicity is what makes it readable, auditable, and reusable.
Align, then average, and the typical appears. Add up many registered images of one category and the idiosyncrasies cancel while the shared structure survives: a prototype that is sharp where the category agrees and blurred where it varies, the map of its own blur doubling as a map of the category's diversity. Everything rests on the alignment (Chapter 12.1, Brute force, Chapter 28.6, Photobios): the mean of misregistered images is mush, and the sharpness of the result is a readout of the registration. The average is the non-parametric category mean, the MMSE "safe and dull" center of Chapter 7.1, Imaging as Bayesian inference with probabilistic priors, which is exactly why it is bland, and exactly why it is so useful for visualizing a dataset, auditing its biases, and building priors. And it carries a permanent caution in its founding: the same operation Galton built to manufacture prejudice is the one we now use to expose it. The method was always neutral; only its use ever had a moral sign.
Recap: big lessons of this chapter
Align, then average, and the typical appears. Add up many registered images of one category and the idiosyncrasies cancel while the shared structure survives: a prototype that is sharp where the category agrees and blurred where it varies, the map of its own blur doubling as a map of the category's diversity. Everything rests on the alignment (Chapter 12.1, Brute force, Chapter 28.6, Photobios): the mean of misregistered images is mush, and the sharpness of the result is a readout of the registration. The average is the non-parametric category mean, the MMSE "safe and dull" center of Chapter 7.1, Imaging as Bayesian inference with probabilistic priors, which is exactly why it is bland, and exactly why it is so useful for visualizing a dataset, auditing its biases, and building priors. And it carries a permanent caution in its founding: the same operation Galton built to manufacture prejudice is the one we now use to expose it. The method was always neutral; only its use ever had a moral sign.