9.4 Towards meaningful user studies⧉
A super-resolution method may produce plausible detail that differs from the original scene. A tone map may preserve detail yet look unpleasant. Pixel fidelity, preference, realism, and usefulness are different questions. Some admit a reference image; claims about what people prefer or can do require evidence about people.
This chapter follows the practical concerns raised by Bylinskii, Herman, Hertzmann, Hutka, and Zhang in Towards Better User Studies in Computer Graphics and Vision Bylinskii et al. 2023, available from the authors' survey. Hertzmann's commentary Hertzmann 2023 argues against studies performed mainly to satisfy an expectation of quantitative evaluation. The aim here is to make a study answer a useful question, with a design and analysis that support the claimed conclusion.
9.4.1 How we got here⧉
Human evaluation was rare in graphics papers until recently. Of the 103 papers at SIGGRAPH 2008, three performed any human evaluation and none reported a user evaluation of an interface Bylinskii et al. 2023. Papers were judged mostly on their ideas and figures.
Crowdsourcing changed the cost. From around 2008, Amazon Mechanical Turk and similar services made a question like "which image is better, A or B?" cheap enough to run overnight with hundreds of participants, and the practice spread through vision and graphics within a few years. The methods that perception and user-experience research had developed over decades spread more slowly: balanced conditions, counterbalancing, effect sizes, attention to confounds and deliberate sampling.
Crowdsourcing made image comparisons easier to recruit and run. It did not remove the need to choose a population, control presentation, or analyze repeated judgments correctly. A table of preference percentages can look persuasive even when the question or sampling is poorly specified. Bylinskii and colleagues give two cautionary cases: a study concluding that people cannot identify AI-generated artwork, run with crowdworkers viewing small images out of context and then reported in the press as a general claim, and several crowdsourced studies of one hypothesis, by the same authors, that reached different conclusions with different tests Bylinskii et al. 2023.
Hertzmann calls studies run chiefly to meet publication expectations performative Hertzmann 2023. The problem is their purpose: the authors have no clear question whose answer would alter their understanding or design. Cheap data collection cannot repair that.
9.4.2 Should you run a study at all?⧉
State what you want to learn before choosing an interface or recruiting participants. Does the claim concern a visible artifact you can already demonstrate, a preference among outputs, or performance on a task? What would each plausible result change?
If the question concerns other viewers, your own inspection cannot settle it. But a study also needs adequate images, suitable participants, and a credible procedure. Narrow the claim if those resources are unavailable. Early prototypes may benefit more from observation and interviews than from comparison against a polished product; Greenberg and Buxton discuss the costs of applying summative evaluation too early Greenberg & Buxton 2008.
Name the question and the decision it informs. A study can guide a design, test a scientific claim, or reveal an unmet need. A required table of numbers is not a research question.
The same question applies to a reviewer requesting a study: what uncertainty should it resolve, and how would different outcomes change the assessment? A request for numbers alone gives the authors no useful experimental target. Following Hertzmann’s argument, we prefer a clearly limited claim to a perfunctory study whose apparent precision exceeds what its design can support.
Repeated human evaluation can be useful when it informs real decisions. Industrial imaging programs can reuse a rating procedure across many comparisons, improving the protocol and connecting its answers to tuning or release choices Delbracio et al. 2021. That investment differs from assembling a study once to complete a paper. The relevant distinction is whether its answer changes a decision and whether the procedure supports that answer.
9.4.3 Three kinds of user research⧉
Output evaluation asks about generated images. Interface evaluation asks whether people can operate a tool. Foundational research investigates needs before a solution is fixed. The distinction matters: liking a retouched photograph says little about whether a photographer can use the controls to obtain it.
Computational-photography papers do almost exclusively the first kind, usually as a crowdsourced A/B comparison. Foundational research is standard in product development and rare in our papers, although it has the most influence on whether the thing being built is worth building.
The three kinds belong at different points of a project. Early methods are generative: observation and interviews during discovery, and concept testing once a design is sketched, help decide what to build. Late methods are evaluative: surveys and usability studies judge what was built. A paper that runs one preference survey after every design decision is frozen has used only the last of these.
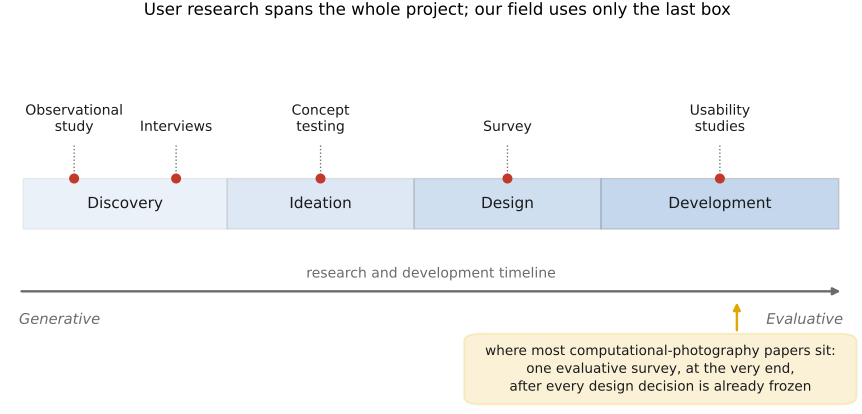
Research can be qualitative or quantitative, attitudinal (what people report) or behavioral (what they do), and generative (informing a design) or evaluative (assessing it). These are useful descriptions of a particular study, not rigid categories that permanently assign a method to one box. Naming them forces a study to say what it measures: a typical preference survey is quantitative, attitudinal and evaluative, which is a narrow slice of what user research can learn.
9.4.4 Comparing outputs, and the checklist that makes it mean something⧉
A pairwise preference trial shows two outputs and asks the participant to choose one. Other designs collect a rating, a detection judgment, or a ranking. A two-alternative task specifies a response format; it is not automatically a randomized controlled trial or a product A/B test.
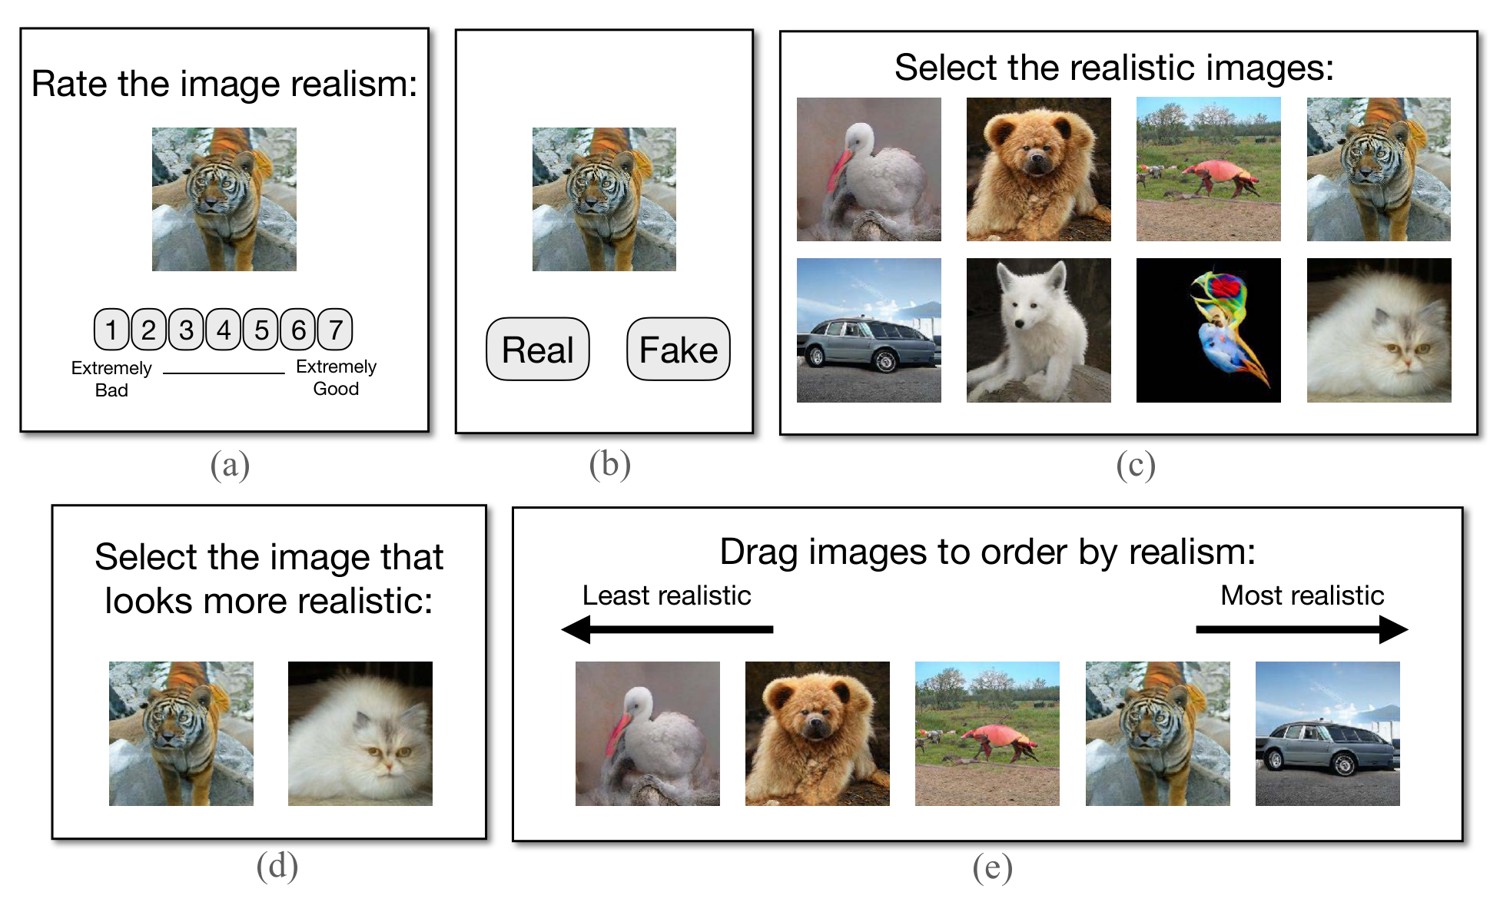
Define the claim and question together. “Which do you prefer?” measures preference; “which is closer to the reference?” measures perceived fidelity. Asking about color artifacts is appropriate when color-artifact detection is the question, but not when the intended claim is overall preference. Pilot the wording and publish it verbatim.
Sample images from the intended use. Random selection from a suitable dataset reduces cherry-picking; deliberate strata can ensure coverage of rare but important conditions. Record both the population and selection rule. Tune every method under a comparable budget on separate development images, then freeze parameters before evaluating. Comparing defaults is legitimate for an out-of-the-box claim, not for the best attainable result of each method.
Hide method identities, randomize left/right placement, and balance presentation order. Hold image size, display transform, crop, and viewing instructions constant. For subtle noise or color comparisons, specify the screen and ambient conditions or acknowledge that a remote study measures a range of uncontrolled conditions. Pilot on the actual interface: resizing and browser color handling can change the stimulus.
Choose whether each participant sees all conditions or only a subset. Within-participant comparisons reduce some differences between people but introduce learning, fatigue, and carryover. Counterbalancing helps distribute these effects. Do not show someone an unmanageably long series merely to obtain every possible pair.
Recruit the intended audience. A retouching tool needs evidence from people who perform the relevant work; a general consumer preference claim needs a broader sample. Record relevant experience and include the diversity the application encounters. Remote sessions widen access across geography and disability; plan for time zones, pay in local currency, arrange translation where needed, and follow an inclusive-research guide when participants may need accommodations.
Use quality checks with criteria fixed before examining the method comparison. Clear instruction checks and obviously detectable differences can identify some inattentive responses. Repeated subjective trials estimate consistency, but a participant may reasonably choose differently on an ambiguous pair. Do not exclude people merely for disagreeing with your preferred result. Chmielewski and Kucker document data-quality problems in the crowdsourced sample they studied Chmielewski & Kucker 2020; that does not establish one failure rate for every platform or population.
Plan the analysis and sample size before collecting the final data. Pilot estimates and the smallest effect that would matter can guide a power analysis or simulation. Distinguish the number of participants, images, and judgments. If 20 people each judge 50 images, the 1,000 responses are not 1,000 independent people or images. For claims intended to generalize across both, use an analysis that models both sources of variation, such as a suitable mixed-effects model, or a resampling procedure designed for that crossed structure. A naive binomial interval over every click can be much too narrow.
Report the preference difference or other effect size with an uncertainty interval. For a forced choice, 50% is the equal-choice baseline; a 52% result needs enough precision and practical consequence to matter. Failure to reject equality does not establish equivalence. Define a practically negligible difference and use an equivalence analysis if equivalence is the claim. Prespecify primary comparisons and address multiple testing when comparing many methods or subgroups.
Follow selected judgments with open-ended questions. They can reveal whether “better” meant more natural color, sharper texture, or a more flattering face. These explanations help interpret the scores; they do not automatically establish why every participant responded as they did.
Randomize the presentation. If the baseline always appears on the left, participants infer that the right image is the new one, and some will simply settle into clicking one side. Presentation details that seem cosmetic also matter: image size, the distance between the two images on screen, the order of trials. Pilot the study at a few settings. Piloting catches these confounds, and it also gives an estimate of how much answers vary for reasons having nothing to do with your algorithm, which is the baseline against which any reported difference should be read.
9.4.5 When the tool is the contribution⧉
For a tool, observe people doing the work. A concept test can show whether a proposed interaction makes sense; a usability study can reveal whether people complete a task and where they get stuck. These methods can be useful throughout development.
Recruit people who perform the intended task and first learn their existing workflow. Give comparable instructions and practice, then let them operate the tool without coaching unless assistance is part of the design being tested. Record completion, errors, time, and requested help, as appropriate. Ask about expectations at points of confusion and collect reactions after the task. What people report and what they do may differ; retain both rather than forcing them into one score.
For a new editing tool, begin with a representative task and a participant's existing workflow. Let the participant try the interface before explaining the intended sequence, and record the first point where their expectation differs from the tool's behavior. If you then provide help, distinguish performance before and after that help. Otherwise a smooth guided demonstration can be mistaken for an interface that a new user can operate independently.
Ask what the participant expected at an impasse, and collect their overall reaction after completing the task. Completion time, edits, and undo actions describe behavior; interviews help explain why it occurred. A participant may finish quickly but dislike the result, or work slowly because they are exploring a useful capability. Neither timing nor a satisfaction answer alone captures that distinction Bylinskii et al. 2023.
9.4.6 Asking before building⧉
Needfinding combines observation and interviews to understand prospective users' problems. Patnaik and Becker describe a sequence of framing, observation, questioning, and interpretation Patnaik & Becker 1999. For a photographic tool, watch how people select, edit, and deliver images before assuming which step needs automation.
An interview can be biased by the way the question is asked. Say at the start that there are no right answers. Leave silences instead of finishing sentences. Give no signals of approval or disagreement, including "I agree." Avoid leading questions. Prefer accounts of recent behavior to predictions of future behavior; confident predictions need not describe what participants will actually do. Split double-barreled questions into separate ones. Write a discussion guide that opens with warm-up questions and narrows toward the research question, and treat it as a guide rather than a script, following up on what emerges. Afterwards, account for your own assumptions, which shaped what you asked and what you noticed, and report them as limitations.
Recruit beyond convenient colleagues. Professionals and novices can have different needs, but experience alone does not tell you whether someone wants automation or control. Report how participants were selected and how your own assumptions influenced the interpretation.
Skipping discovery can leave a team optimizing a solution to a problem its intended users do not have. A final preference survey may reveal dissatisfaction without revealing the missed workflow. Observing selection, editing, and delivery early enough to change the design gives that evidence a different use: it can alter what gets built.
9.4.7 The rest of the toolbox⧉
Observation, interviews, concept tests, usability tests, and surveys provide different evidence. Diary studies can reveal changes over time; participatory design involves users in developing a solution; eye tracking records where they look, which does not by itself reveal preference or understanding.
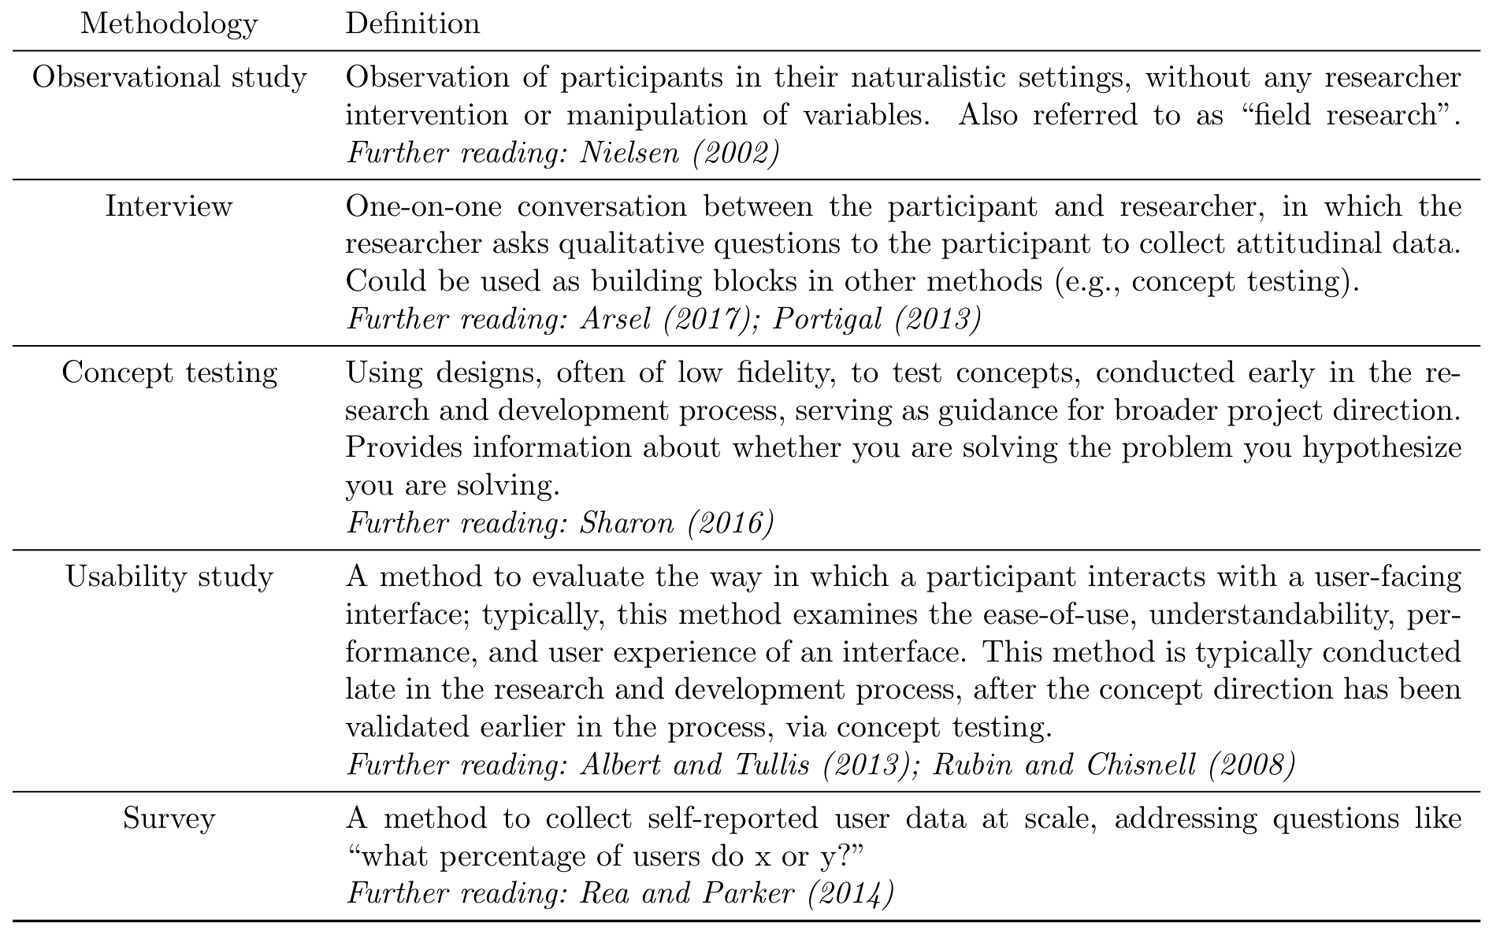
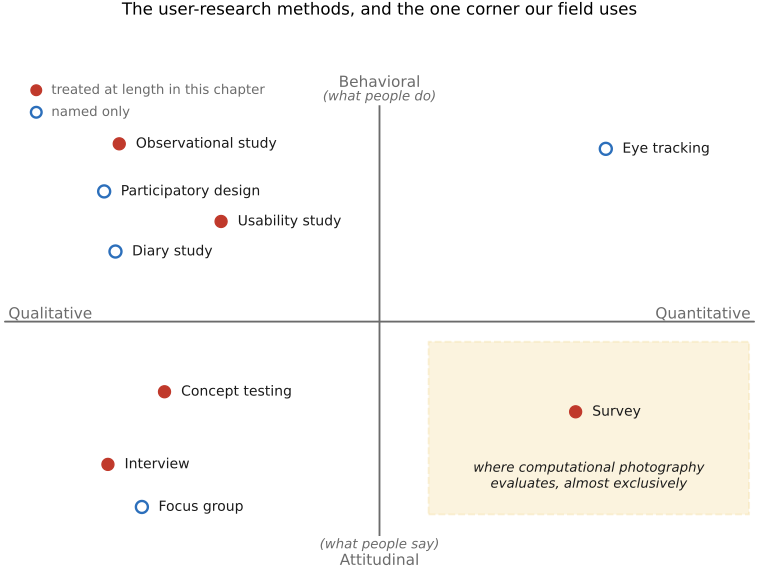
A cognitive walkthrough asks whether an imagined user would know what to do at each step. Heuristic evaluation checks an interface against established usability principles Nielsen & Molich 1990. Both can identify problems before recruitment, but neither directly measures the intended users' behavior.
Combining methods is useful when they answer complementary questions. A free-text survey response may explain a particular rating; an interview can probe that explanation further. Neither guarantees a causal account of the numerical result.
9.4.8 Reporting, and calling it what it is⧉
Describe recruitment, participant counts and relevant characteristics, stimulus selection, method settings, display conditions, instructions, trial order, compensation, and exclusions. Report the analysis, effect sizes, uncertainty, and whether the procedure changed after piloting. Make materials and analysis code available where consent and data restrictions permit. An incomplete report limits what others can check.
Use a specific name: human rating study, detection experiment, interview, or usability test. Call people participants or raters when they are judging outputs rather than operating a tool.
Interpret the result at the scale sampled. Preferences for small images viewed by crowdworkers do not establish preferences among professional retouchers working at full resolution. A confidence interval describes sampling uncertainty under the analysis assumptions; it does not account for every mismatch between the sample and the intended audience.
9.4.9 Doing it ethically⧉
Follow the applicable institutional review process. Explain the procedure and data collection, obtain consent, and ask before recording. Minimize identifiable data and restrict access to recordings and personal information. Image-editing tasks may reveal private photographs or sensitive appearance judgments, which should be considered in the study design.
Compensate participants fairly for the actual time, including instructions and practice. Make the task accessible to the intended population, provide appropriate accommodations, and explain any eligibility criteria. Remote participation can broaden access, but also excludes people without suitable devices or connections.
9.4.10 Why these studies fail to replicate⧉
Terminology varies across fields. Here, reproducibility means obtaining the reported analysis from the same data and code; replication means collecting new data to test the finding. Both matter.
Unplanned stopping, selective reporting, stimulus changes, and exclusions chosen after seeing the results can make an apparent effect unreliable. Record the design and analysis in advance, retain deviations, and report them. A larger sample narrows some uncertainty; it does not repair a leading question or biased image selection.
Diverse recruitment and appropriate test images help expose failures that a homogeneous development group may miss; the broader consequences of biased systems are discussed by Noble Noble 2018 and in Chapter 40.2, Ethics of computational photography. State who was included and what remains untested. A study supports conclusions within its design, not a claim about everyone.
The last problem is who gets asked. Homogeneous participant pools can preserve the developers’ blind spots, leaving failures to emerge in shipped systems Noble 2018. The remedy is to recruit for what the technology touches: someone colorblind for a color tool, a screen-reader user for an interface, a range of skin tones, hair types, and body shapes for anything applied to people. This is the same argument the ISP chapters make about tuning on a diverse test set (Chapter 8.10, Auto-exposure and auto white balance), arriving from the other direction.
Recap: big lessons of this chapter
Name the question and the decision it informs. A study can guide a design, test a scientific claim, or reveal an unmet need. A required table of numbers is not a research question.