4.7 Synthesizing color⧉
Sensing a color projects a spectrum onto three numbers; synthesizing one runs that backward, building light from a few primaries so that a human sees the intended color. The projection threw information away and cannot be undone, so synthesis does not rebuild the original spectrum, only a metamer of it, and it must do so with real lights or real inks, which can only add or absorb, never contribute a negative amount. That single constraint, non-negativity, shapes everything in this chapter: which colors a device can reach (its gamut), what has to happen to the ones it cannot (gamut mapping), and how displays, printers, and film each make their compromise with it.
4.7.1 Additive vs subtractive⧉
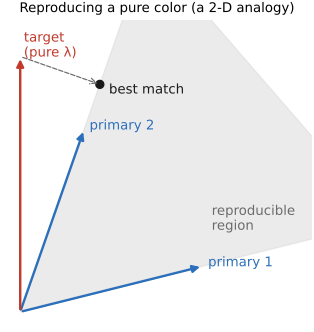
Synthesis, building a color from primaries, is where the constraints of non-orthogonality and non-negativity become concrete. Suppose we want to reproduce a single monochromatic test color, a pure wavelength, using three fixed primaries (Figure 4.7.1). In the linear-algebra picture this is asking for weights $w_i$ such that $\sum_i w_i \mathbf{P}_i$ matches the target. The 2-D analogy makes the trouble plain: with two non-perpendicular basis vectors you can reach any point in the plane if you are allowed negative coefficients, but a primary is a light, and you cannot emit a negative amount of it. So the reachable colors are not the whole plane but only the convex cone of non-negative combinations. Non-orthogonality plus non-negativity turns some perfectly real colors into impossible reproductions: the saturated cyans that needed negative matches in the color-matching experiment simply cannot be made by adding three real primaries.
Concretely, stack the three primaries as the columns of a matrix $P$, each column a primary's tristimulus, so $P$ has the signature $P : \mathbf{w} \to \mathrm{XYZ}$ (weights in, a color out). An additive mixture is a non-negative weighted sum, and reproducing a target $\mathbf{c}$ is one solve:
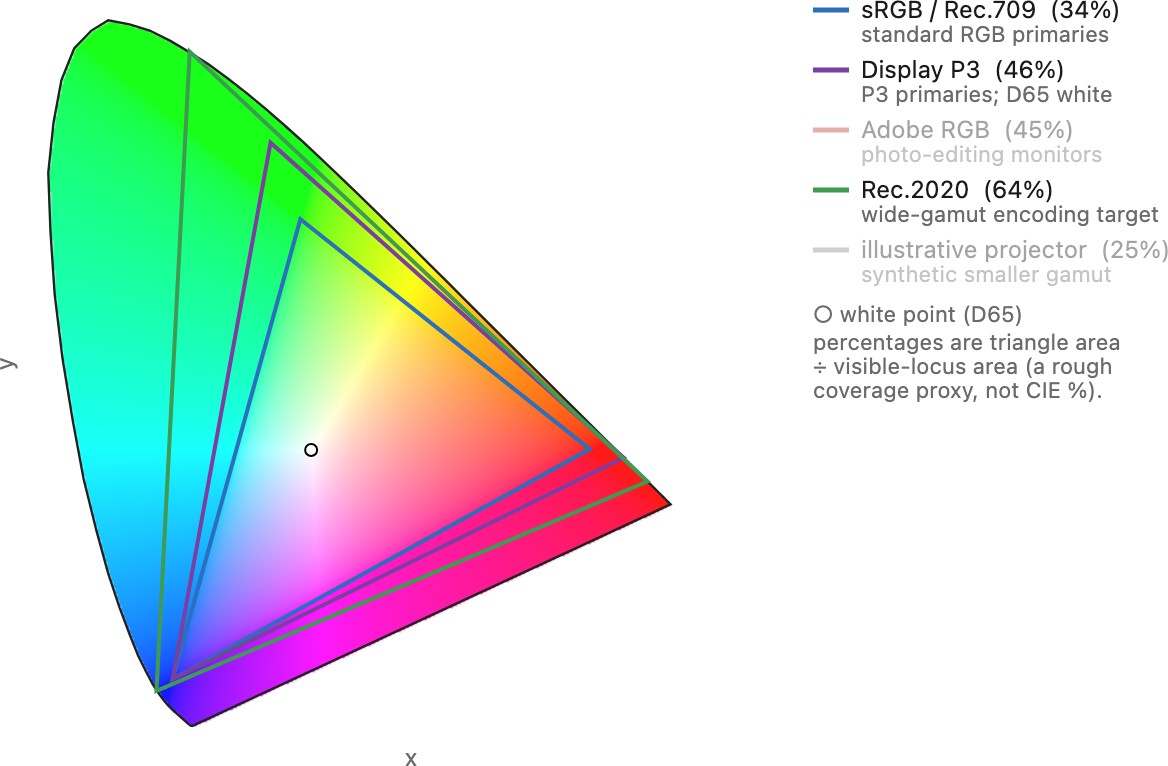
For ideal independent primaries with maximum drives normalized to one and zero black offset, the target is reachable when $0\le w_i\le1$ for every channel. Nonnegativity alone describes an unbounded intensity cone. The gamut is that constraint drawn out: the convex cone $\{P\mathbf{w} : \mathbf{w} \ge 0\}$, which on the chromaticity diagram (tristimulus-normalized) is the triangle of the primaries. A weight forced negative is the non-negativity wall, a real color the device cannot make. These weights specify linear primary intensities. Converting them to hardware codes requires the calibrated inverse of the device’s code-to-light response.
Nonnegative mixtures of fixed additive primaries lie within their chromaticity hull. Three primaries give a triangle. Maximum drive and black level also constrain the full three-dimensional gamut. Subtractive printing is not described by the same triangle rule: ink interactions and the paper must be characterized.
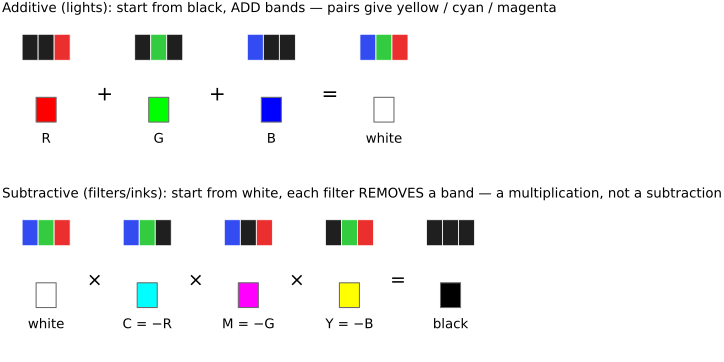
There are two physically distinct ways to mix color, and the distinction is more subtle than the names suggest. Split the spectrum into three coarse bands and pretend they are pure B, G, R (Figure 4.7.2). Additive mixing (lights) starts from black and adds bands: $R + G + B$ gives white, and the pairs give yellow, cyan, magenta. Subtractive mixing (filters and inks) starts from white and each layer removes a band, with cyan, magenta, yellow stacking toward black. But "subtractive" is a misleading name: stacking filters is really a wavelength-by-wavelength multiplication of the spectrum.
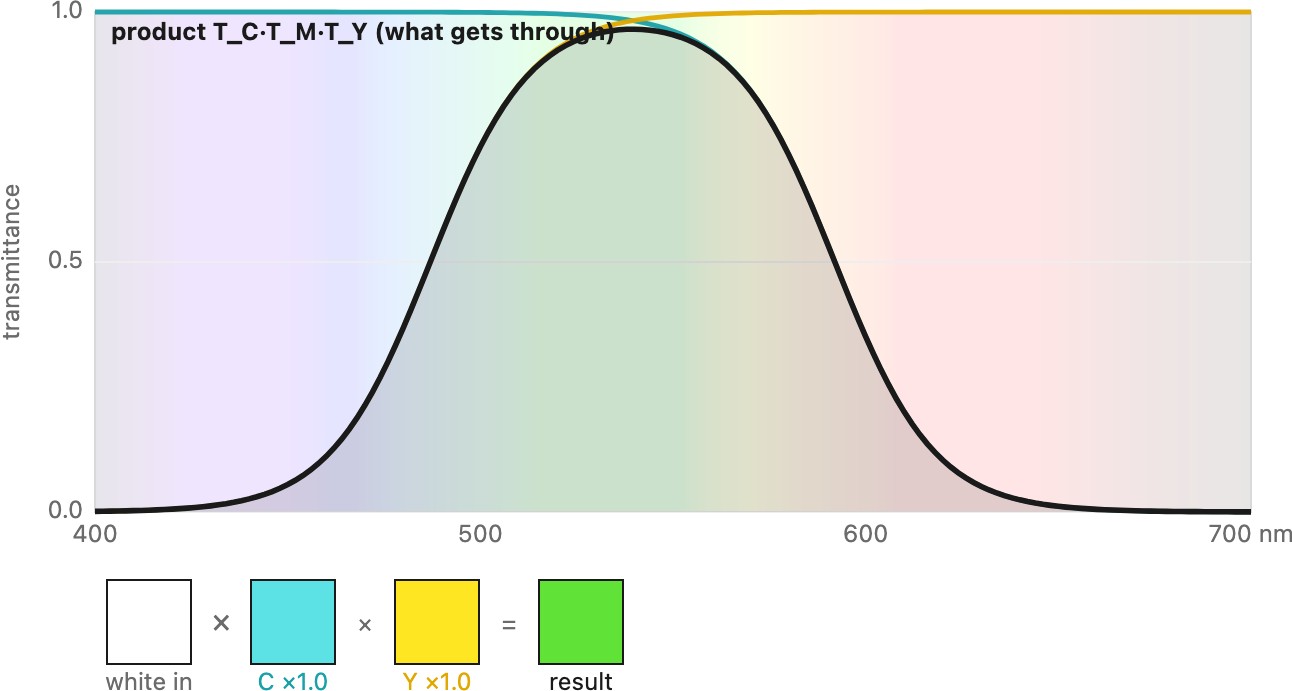
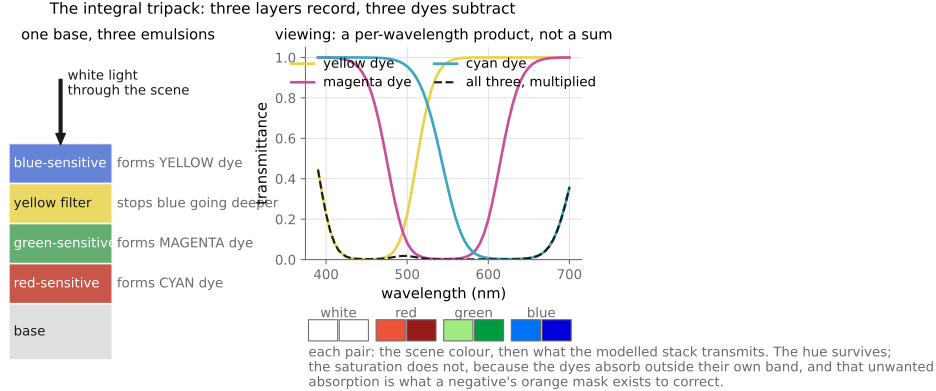
This is easy to see with filter transmittances. A yellow filter blocks blue; a cyan filter blocks red. Stack them and the only band that survives is the overlapping green, so yellow $\times$ cyan = green, which is a product of the two transmittance spectra $T_Y(\lambda)\cdot T_C(\lambda)$, not any kind of sum (Figure 4.7.3). In general a stack of dyes multiplies transmittances wavelength by wavelength,
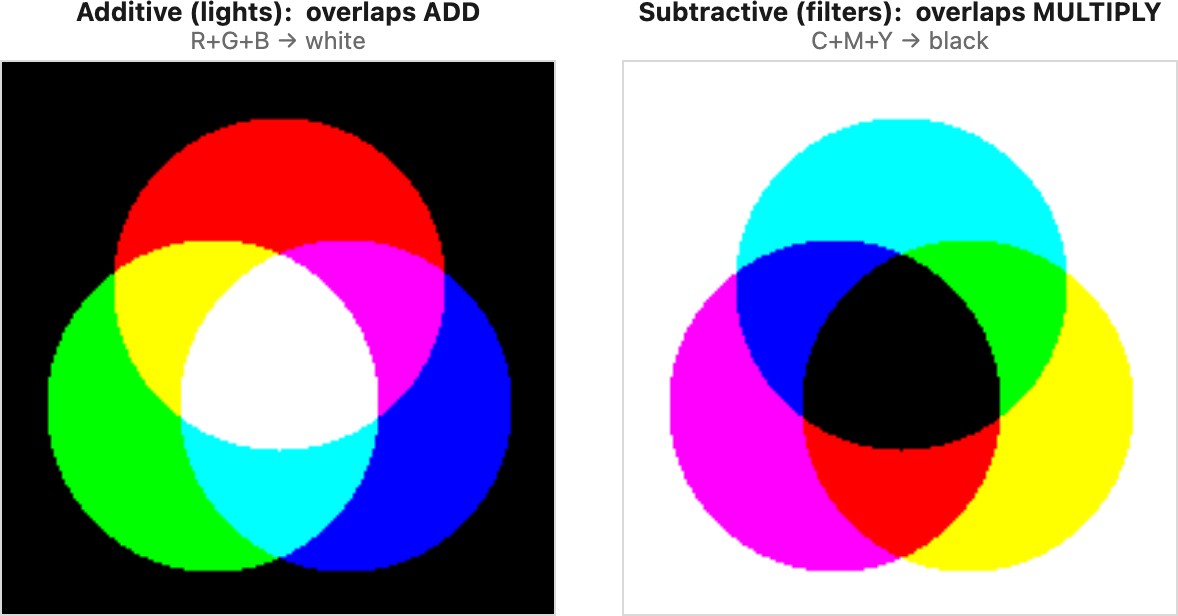
a product that in log transmittance (optical density) becomes a sum, which makes density useful for ideal dye-layer calculations and why "subtractive" is a misnomer for a multiplication. The overlapping-disks picture captures both regimes at a glance: RGB lights overlapping toward white versus cyan-magenta-yellow (CMY) inks overlapping toward black (Figure 4.7.4). And real systems are often hybrid: an LCD projector, for instance, uses a white lamp, panels that subtract (modulate) each channel, and then adds the three channels on the screen.
CRTs and OLEDs emit light; LCDs modulate a backlight through filters. Their subpixel outputs mix additively at viewing distance. Printed layers absorb and scatter light, while halftone areas also mix spatially. The ideal transmittance product assumes independent non-scattering layers and neglects interface reflections; a print needs a more complete model or measured profile.
4.7.2 Gamut and gamut mapping⧉
The destination has a bounded set of reproducible tristimulus values. A chromaticity diagram shows part of that limit, but a target can lie inside the primary triangle and still demand excessive luminance. Use the full gamut for output decisions.
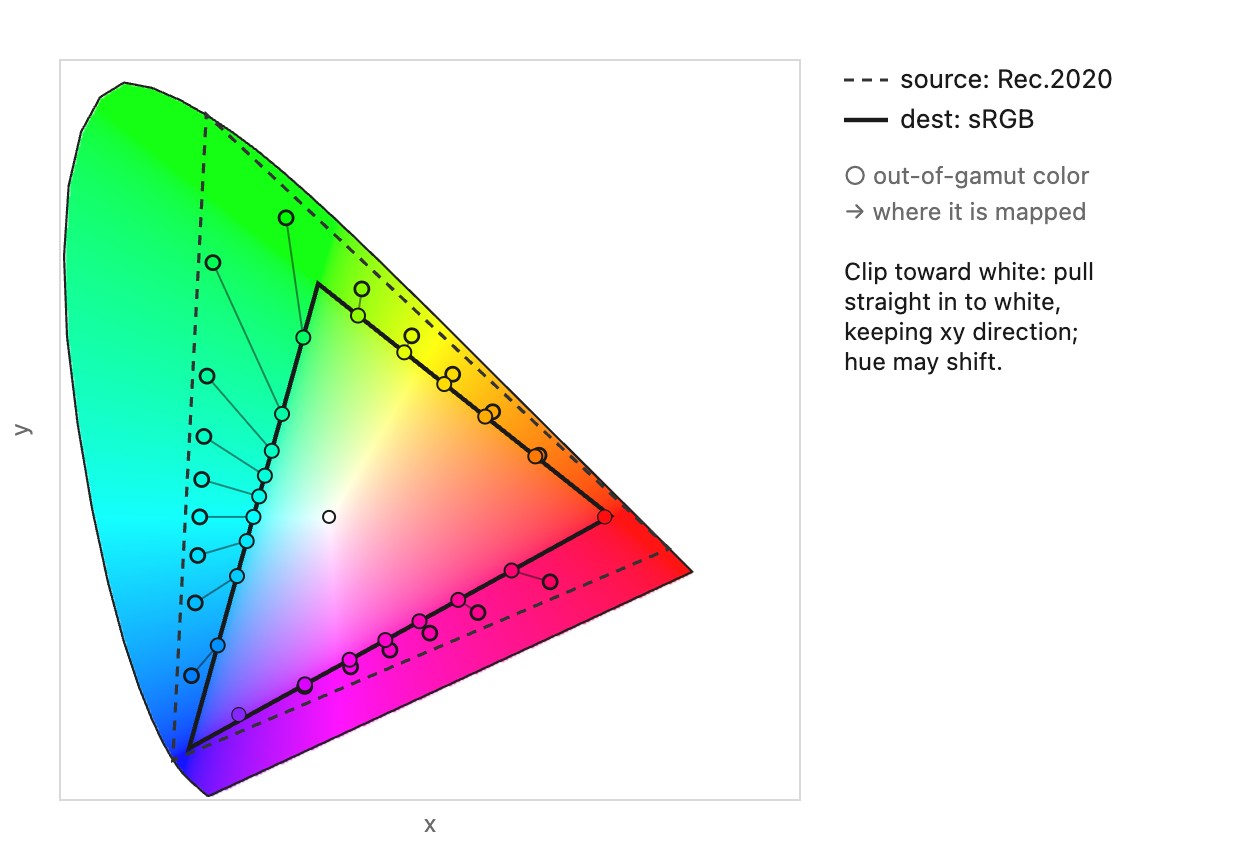
Gamut mapping changes colors the destination cannot reproduce, and may also change nearby in-gamut colors to preserve smooth variation. Channel clipping is cheap but can change hue and collapse distinct colors. Nearest-boundary mapping depends on the distance metric. A line toward white in xy does not generally preserve perceptual hue or lightness.
One simple perceptual-coordinate construction holds Lab lightness and hue fixed and reduces chroma:
This assumes the destination has a feasible neutral and chroma interval at that lightness. If it does not, lightness must change too. A soft compression replaces this hard limit with a continuous function that also moves some in-gamut values. No mapping preserves every original difference when the output gamut is smaller.
A nearest-color formulation is
with destination gamut $\mathcal G$ and a stated color-difference measure $d$. This need not agree with channel clipping or constant-hue chroma reduction. Choose by the image and output objective, then inspect saturated texture, gradients, and important colors. A brand color outside the output gamut cannot be made exact by selecting a different clipping rule.
ICC rendering intents describe conversion objectives rather than one universal clipping or compression algorithm. Their results depend on profiles and the color-management module; see Chapter 4.8, Recap: the full color pipeline, color management and ICC.
Imagine a red channel that rises smoothly from 0.9 through 1.1 to 1.3 while the other channels remain fixed. Clipping that channel at 1 preserves the first part of the ramp but makes all its higher values identical. Any texture encoded only by those differences disappears. A compression that begins before the boundary can retain distinctions among the higher values, at the cost of changing some values that were already reproducible. This is the practical choice behind the two families: where to spend the available color differences. The mapping's color space and trajectory also matter, because preserving a straight line in chromaticity coordinates does not guarantee constant perceptual hue.
4.7.3 Display technologies and multiplexing⧉
There are two ways to put an image in front of the eye: a screen you look at, and a projector whose reflection you look at. A screen produces or modulates light right at the image plane. A projector modulates a small, bright beam and a lens throws it onto a separate white screen, so what you see is reflected light. Projectors buy size cheaply, a wall-sized image from a shoebox, but they pay for it in brightness and contrast: the throw spreads a fixed lumen output over a large area, and any ambient light in the room also lands on the screen and lifts the blacks, so a projected black is only as dark as the room. Direct-view displays also reflect ambient light; their coatings, brightness, and viewing geometry affect contrast.
Within both, the pixel is built one of three ways. Emissive displays (OLED, microLED, the old CRT and plasma) make light at every pixel, with black level and viewing-angle behavior depending on the technology and ambient reflection. Transmissive displays, the LCD, put a fixed white backlight behind a grid of per-pixel valves that pass or block light through red, green, and blue filters (Figure 4.7.7). In a simplified twisted-nematic design, the valve is a liquid crystal that rotates the light's polarization by an amount the voltage sets, sitting between two crossed polarizers, so a subpixel is a light gate, not a light source. LCDs are cheap, bright, and everywhere, but the valve leaks a little, so their blacks are never quite black and their contrast trails OLED. Reflective modulators steer reflected light instead: the printed page (the next section), electronic ink, and the digital micromirror device (DMD) at the heart of DLP projectors, an array of tiny mirrors that each tilt to throw light either into the lens or into a black light dump, using temporal modulation for gray levels; single-chip designs may sequence colors with a wheel or switched light sources (Figure 4.7.8). Most projectors are built on one of DMD (DLP), LCD, or LCoS (liquid crystal on silicon, a reflective LCD), a choice that trades contrast, cost, and the "rainbow" flashes of sequential color.
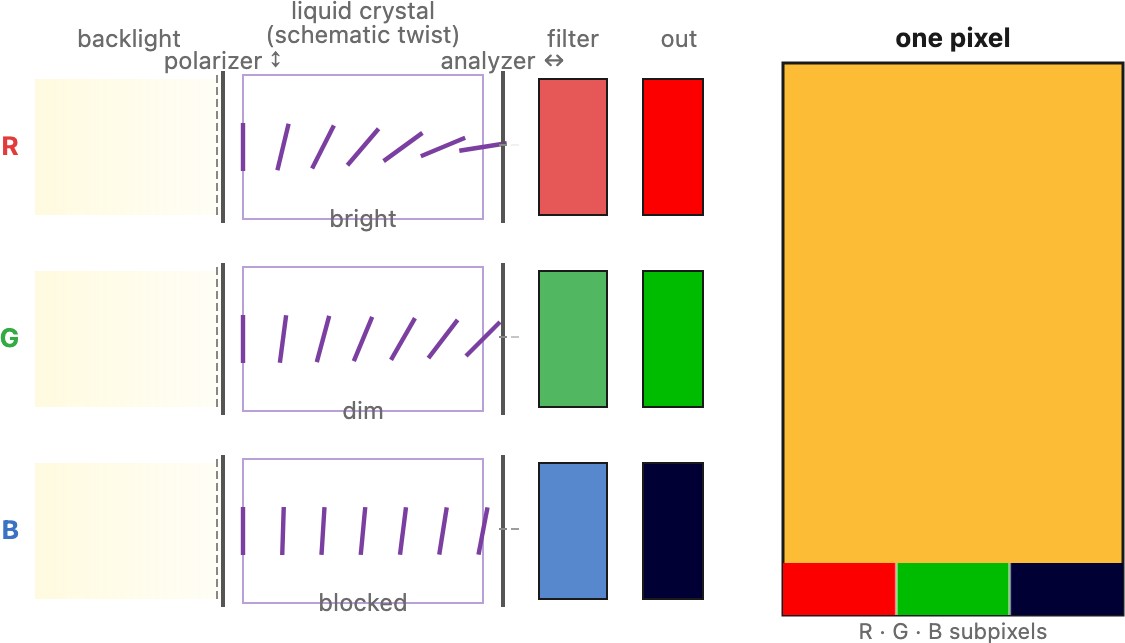
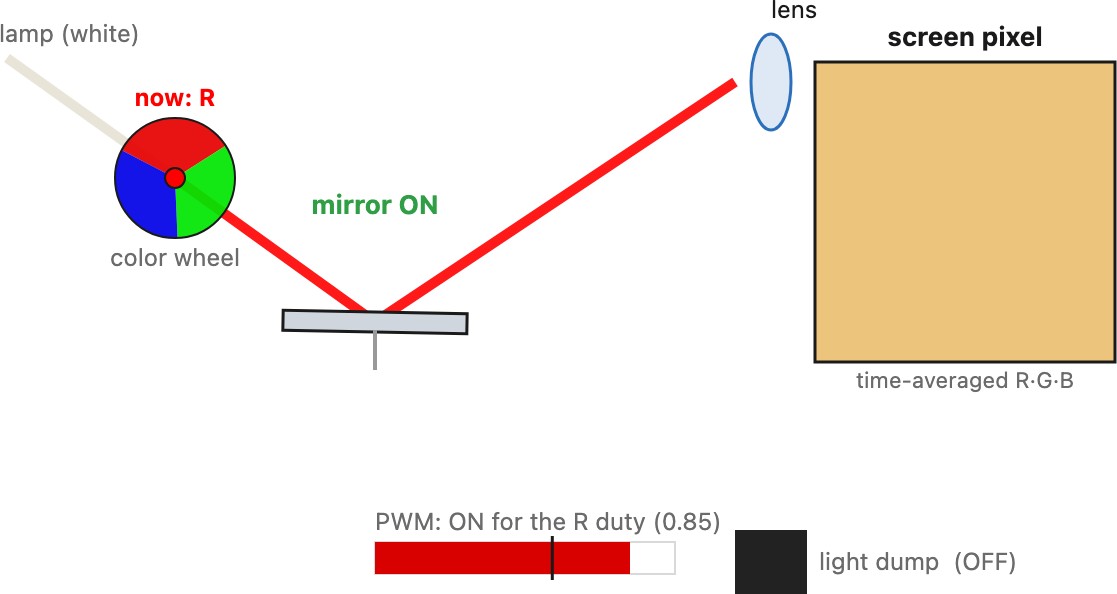
Either way the display multiplexes color, the mirror image of how a sensor does it (Chapter 4.6, Sensing color: multiplexing strategies): in space, across red, green, and blue subpixels the eye fuses at a distance, and in time, when a single DMD flashes the three primaries in sequence through a color wheel fast enough that the eye averages them into one color. Analysis splits a spectrum into three numbers; synthesis multiplexes three numbers back into an apparent spectrum.
4.7.4 Display families and their viewing conditions⧉
Display families realize color with different spatial and temporal arrangements. An LCD attenuates a backlight through controlled cells and color filters; emissive displays generate light locally. Projection can separate primaries across devices or sequence them in time. These implementations determine which primaries can be produced and how neighboring pixels or successive color fields interact.
A reflective print depends on its illuminant as well as ink and paper. An emissive display adds light but also reflects its surroundings. Gamut and black level must therefore be stated for a viewing condition, not inferred from a technology label alone. Local dimming is treated in HDR displays and display mapping#HDR displays and dual modulation, while Chapter 5.6, Preparing photographs for viewing turns the output characteristics into photographic decisions.
4.7.5 Printing and halftoning⧉
A print is a reflective image: it makes no light of its own but modulates the light of the room, so its brightness and contrast are set by the paper and the ambient light. Its color depends on ink, paper, screening, and illumination.
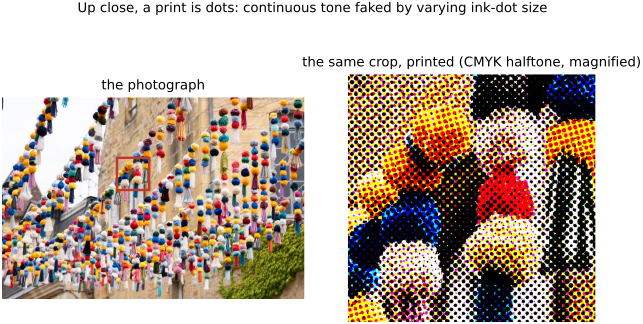
Inkjet systems place discrete droplets, sometimes with several droplet sizes or multiple light and dark inks. Halftoning controls local area coverage rather than requiring a continuously adjustable pigment at every point. Continuous tone is faked by halftoning: laying down dots whose size or spacing varies so that, averaged by the eye at a normal distance, a field of small dots reads as light gray and a field of large ones as dark (Figure 4.7.9). Up close the illusion breaks and the dot structure appears, which is the signature of a print. The classic screen prints the inks at different angles so their dots interleave into a rosette rather than clashing into moiré.
Second, ink mixes subtractively and imperfectly. The process inks are cyan, magenta, and yellow, each subtracting a band (#Additive vs subtractive), plus a separate black (K) because stacking C, M, and Y never makes a true dense black and mixing three inks for every dark pixel wastes ink and soaks the paper. Real inks are not the ideal blockers of the theory: their absorption bands are broad and overlapping, so the reachable gamut is small and skewed, dot gain (physical spreading and optical effects within the paper) darkens the midtones, and the paper's own tint shifts the whites. Getting a predictable color out of this requires a measured printer profile and heavy gamut mapping (Chapter 4.8, Recap: the full color pipeline, color management and ICC), which is why a print rarely matches the screen it was proofed on without care.
Third, a print is a showcase for metamerism. The inks are mixed to match target colors under a particular viewing light, but a matched color is really a match between two different spectra that only agree under that one light (illuminant metamerism, Chapter 3.3, Visual processing). So two prints, or a print and the original, that match in the shop can visibly diverge under a different bulb. Print shops therefore specify a standard viewing light (often D50), and "does it match?" is never a question you can answer without first naming the light.
4.7.6 Color film⧉
Color film is the original subtractive medium, and it makes a picture exactly the way the additive-versus-subtractive section predicts: not by adding colored light but by stacking dyes that each remove a band from the white light passing through. The trick that made it practical is the integral tripack, three color-sensitive layer groups, often containing multiple emulsions, coated on one base (Figure 4.7.10). The top layer is sensitive to blue, then a yellow filter layer blocks any remaining blue, and the two layers below it record green and red. On development each layer grows a dye complementary to the light it recorded: the blue-recording layer forms yellow dye, the green-recording layer magenta, the red-recording layer cyan. View white light through the developed stack and the three dyes subtract in combination, a per-wavelength product of their transmittances, to rebuild the scene's color. Cyan dye absorbs red. In a color negative, more red exposure produces more cyan density; making a positive requires printing or inversion. Reversal processing instead yields less cyan dye where the scene supplied more red exposure, allowing red light to pass in the viewed positive.
Two chemistries split the history. Kodachrome kept the dye-forming couplers out of the film and introduced them during a complex development (the K-14 process), which made the emulsion thin and sharp and the dyes unusually archival, at the cost of a process only a few labs on Earth could run. Common chromogenic color films instead build the couplers into the emulsion (the C-41 negative and E-6 reversal processes), so color development forms dyes through reactions with those couplers. A color negative records the complementary colors and adds an orange mask to correct the dyes' unwanted absorptions, and is printed to positive; a reversal (slide) film develops straight to a viewable positive.
What gives a stock its recognizable "look" is the same machinery seen from the color side: each of the three layers has its own characteristic curve (Chapter 4.3, Encoding: linear, gamma or log), so the layers differ in contrast, toe, and shoulder, and the real dyes are imperfect, broad, overlapping absorbers rather than the ideal band-blockers of the theory. The particular set of dyes and curves is why Kodak Portra renders skin gently and Fuji Velvia drives skies and foliage to saturation: film "color science" was memory-color tuning done in emulsion chemistry, the direct ancestor of the preferred-color rendering a digital camera now does in software (Advanced color: opponents, perceptually-uniform, and preferred#Preferred colors: skin, sky, and other memory colors). And because the color is carried by three subtractive dyes, film's gamut is limited and skewed in the same way a print's is, for the same reason: subtractive primaries multiply, and real ones are not clean.
4.7.7 Simple display calibration⧉
Calibration adjusts a device toward a target response. Profiling measures and describes the resulting behavior. Instrument-based work can characterize white point, luminance, black level, and channel response; a visual probe offers a much narrower check.
A fine black-and-white checker has mean luminance $(L_b+L_w)/2$ if the display response is spatially independent and the two areas are equal. Match a uniform patch to that spatially fused checker. For a power-law response normalized between black and white, the matching code $V$ satisfies $V^\gamma=0.5$, giving
This estimates one aspect of the complete application-to-light path. It cannot isolate panel gamma or measure primary spectra. Resampling, incomplete visual fusion, pixel structure, ambient light, local dimming, and automatic brightness can bias the result. A near-black visibility chart tests a different property and is not another measurement of gamma.
The black-level version of the trick works at the bottom of the range: a near-black symbol that should be just visible shows where the screen, at its current brightness and in the current room, stops separating dark values, which is why many video games open with a screen asking you to raise the brightness until a symbol is barely visible. In practice, set the browser to 100% zoom so the checker reaches the panel unresampled, step back about a meter or squint until the checker fuses into flat gray, and turn off automatic brightness and ambient-adaptive color modes, which make the screen a moving target. The probes are coarse and pin down one number rather than a full profile, but they cost nothing and catch the gross errors, a response far from the intended curve or crushed or lifted blacks, that would spoil an image the pipeline rendered correctly.
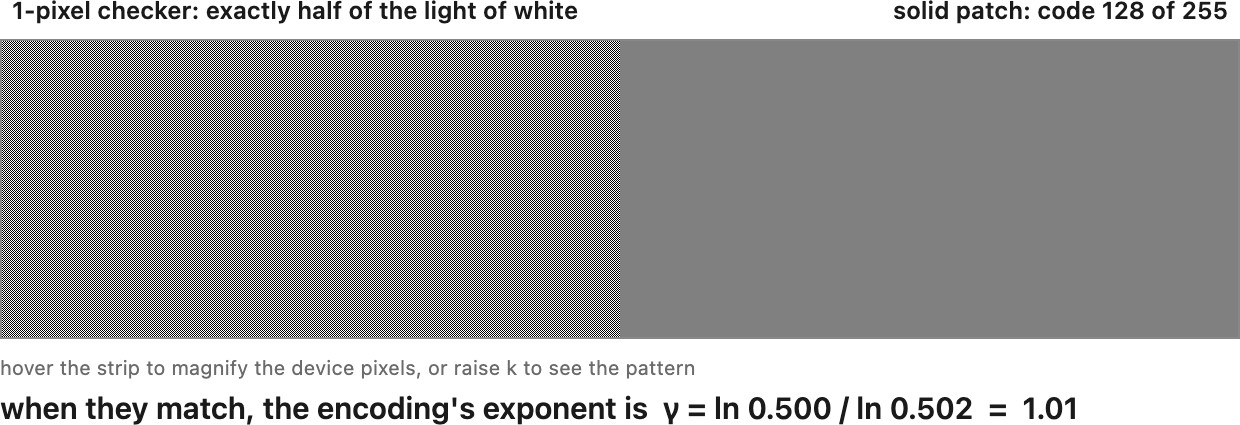
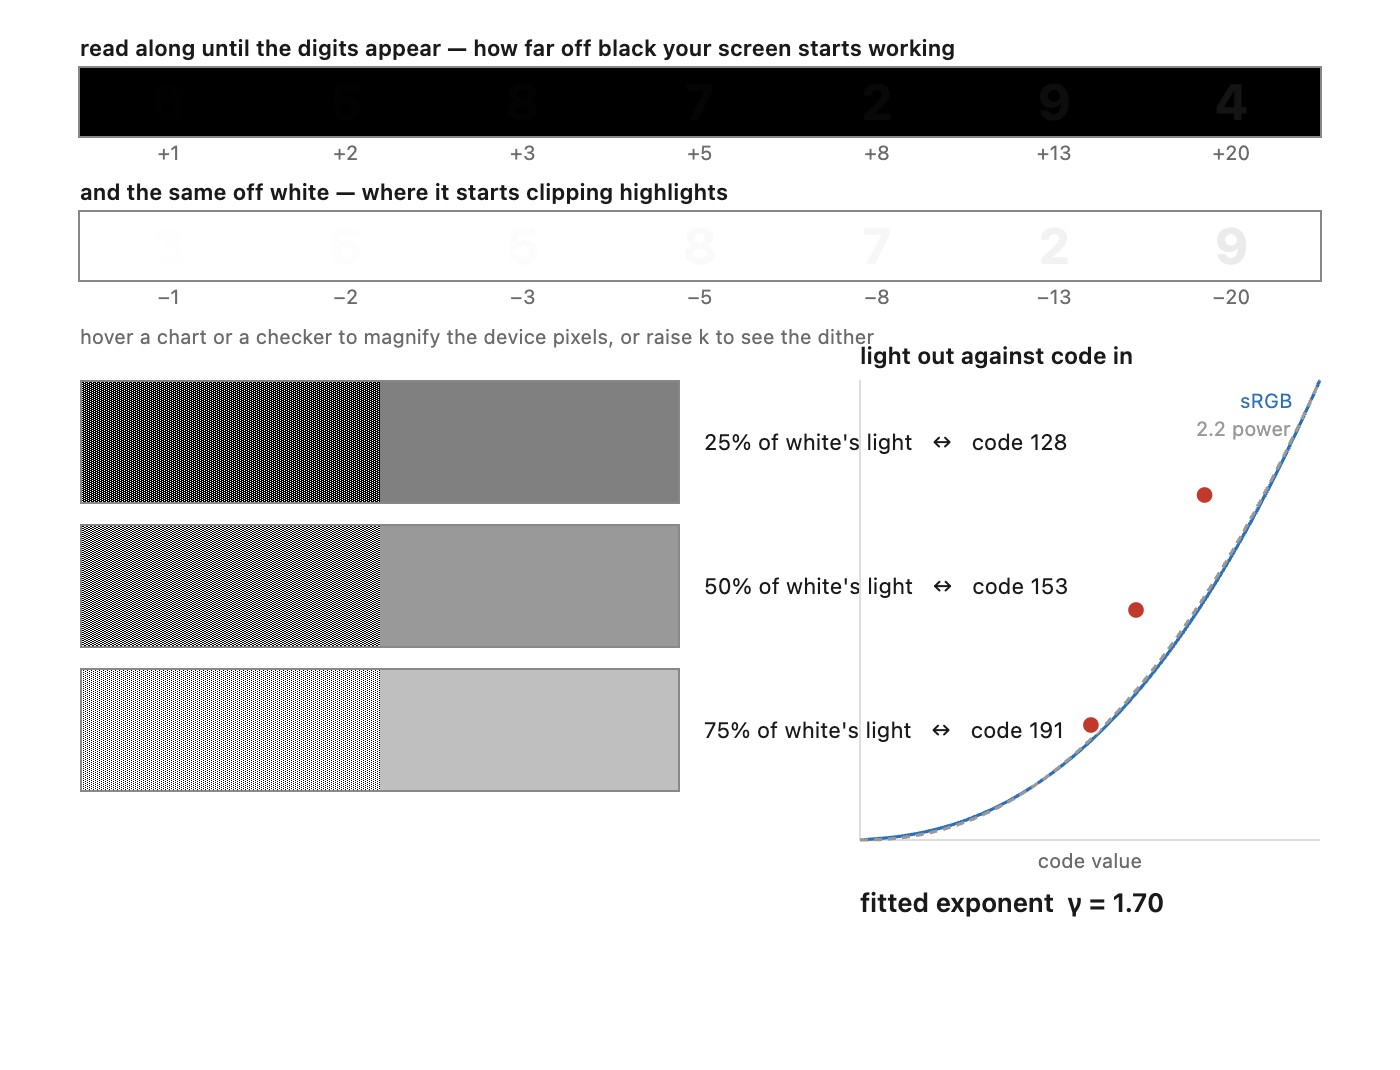
The visual gamma probe compares a uniform gray patch with a fine black-and-white pattern. When the pattern is unresolved, its average emitted luminance is approximately the mean of display black and white. Adjust the uniform patch until it matches that average. Under a pure-power display model with negligible black level, a matching code near 0.73 corresponds to gamma about 2.2, since raising 0.73 to 2.2 gives about one half.
The experiment depends on the pattern actually reaching the display as intended. Browser scaling, resampling, display processing, and a visible grating can alter the comparison. Nonzero black also changes the target luminance. It is an instructive visual estimate of the response curve, not a substitute for instrument calibration or an ICC profile.
Recap: big lessons of this chapter
Nonnegative mixtures of fixed additive primaries lie within their chromaticity hull. Three primaries give a triangle. Maximum drive and black level also constrain the full three-dimensional gamut. Subtractive printing is not described by the same triangle rule: ink interactions and the paper must be characterized.